Covid Cards
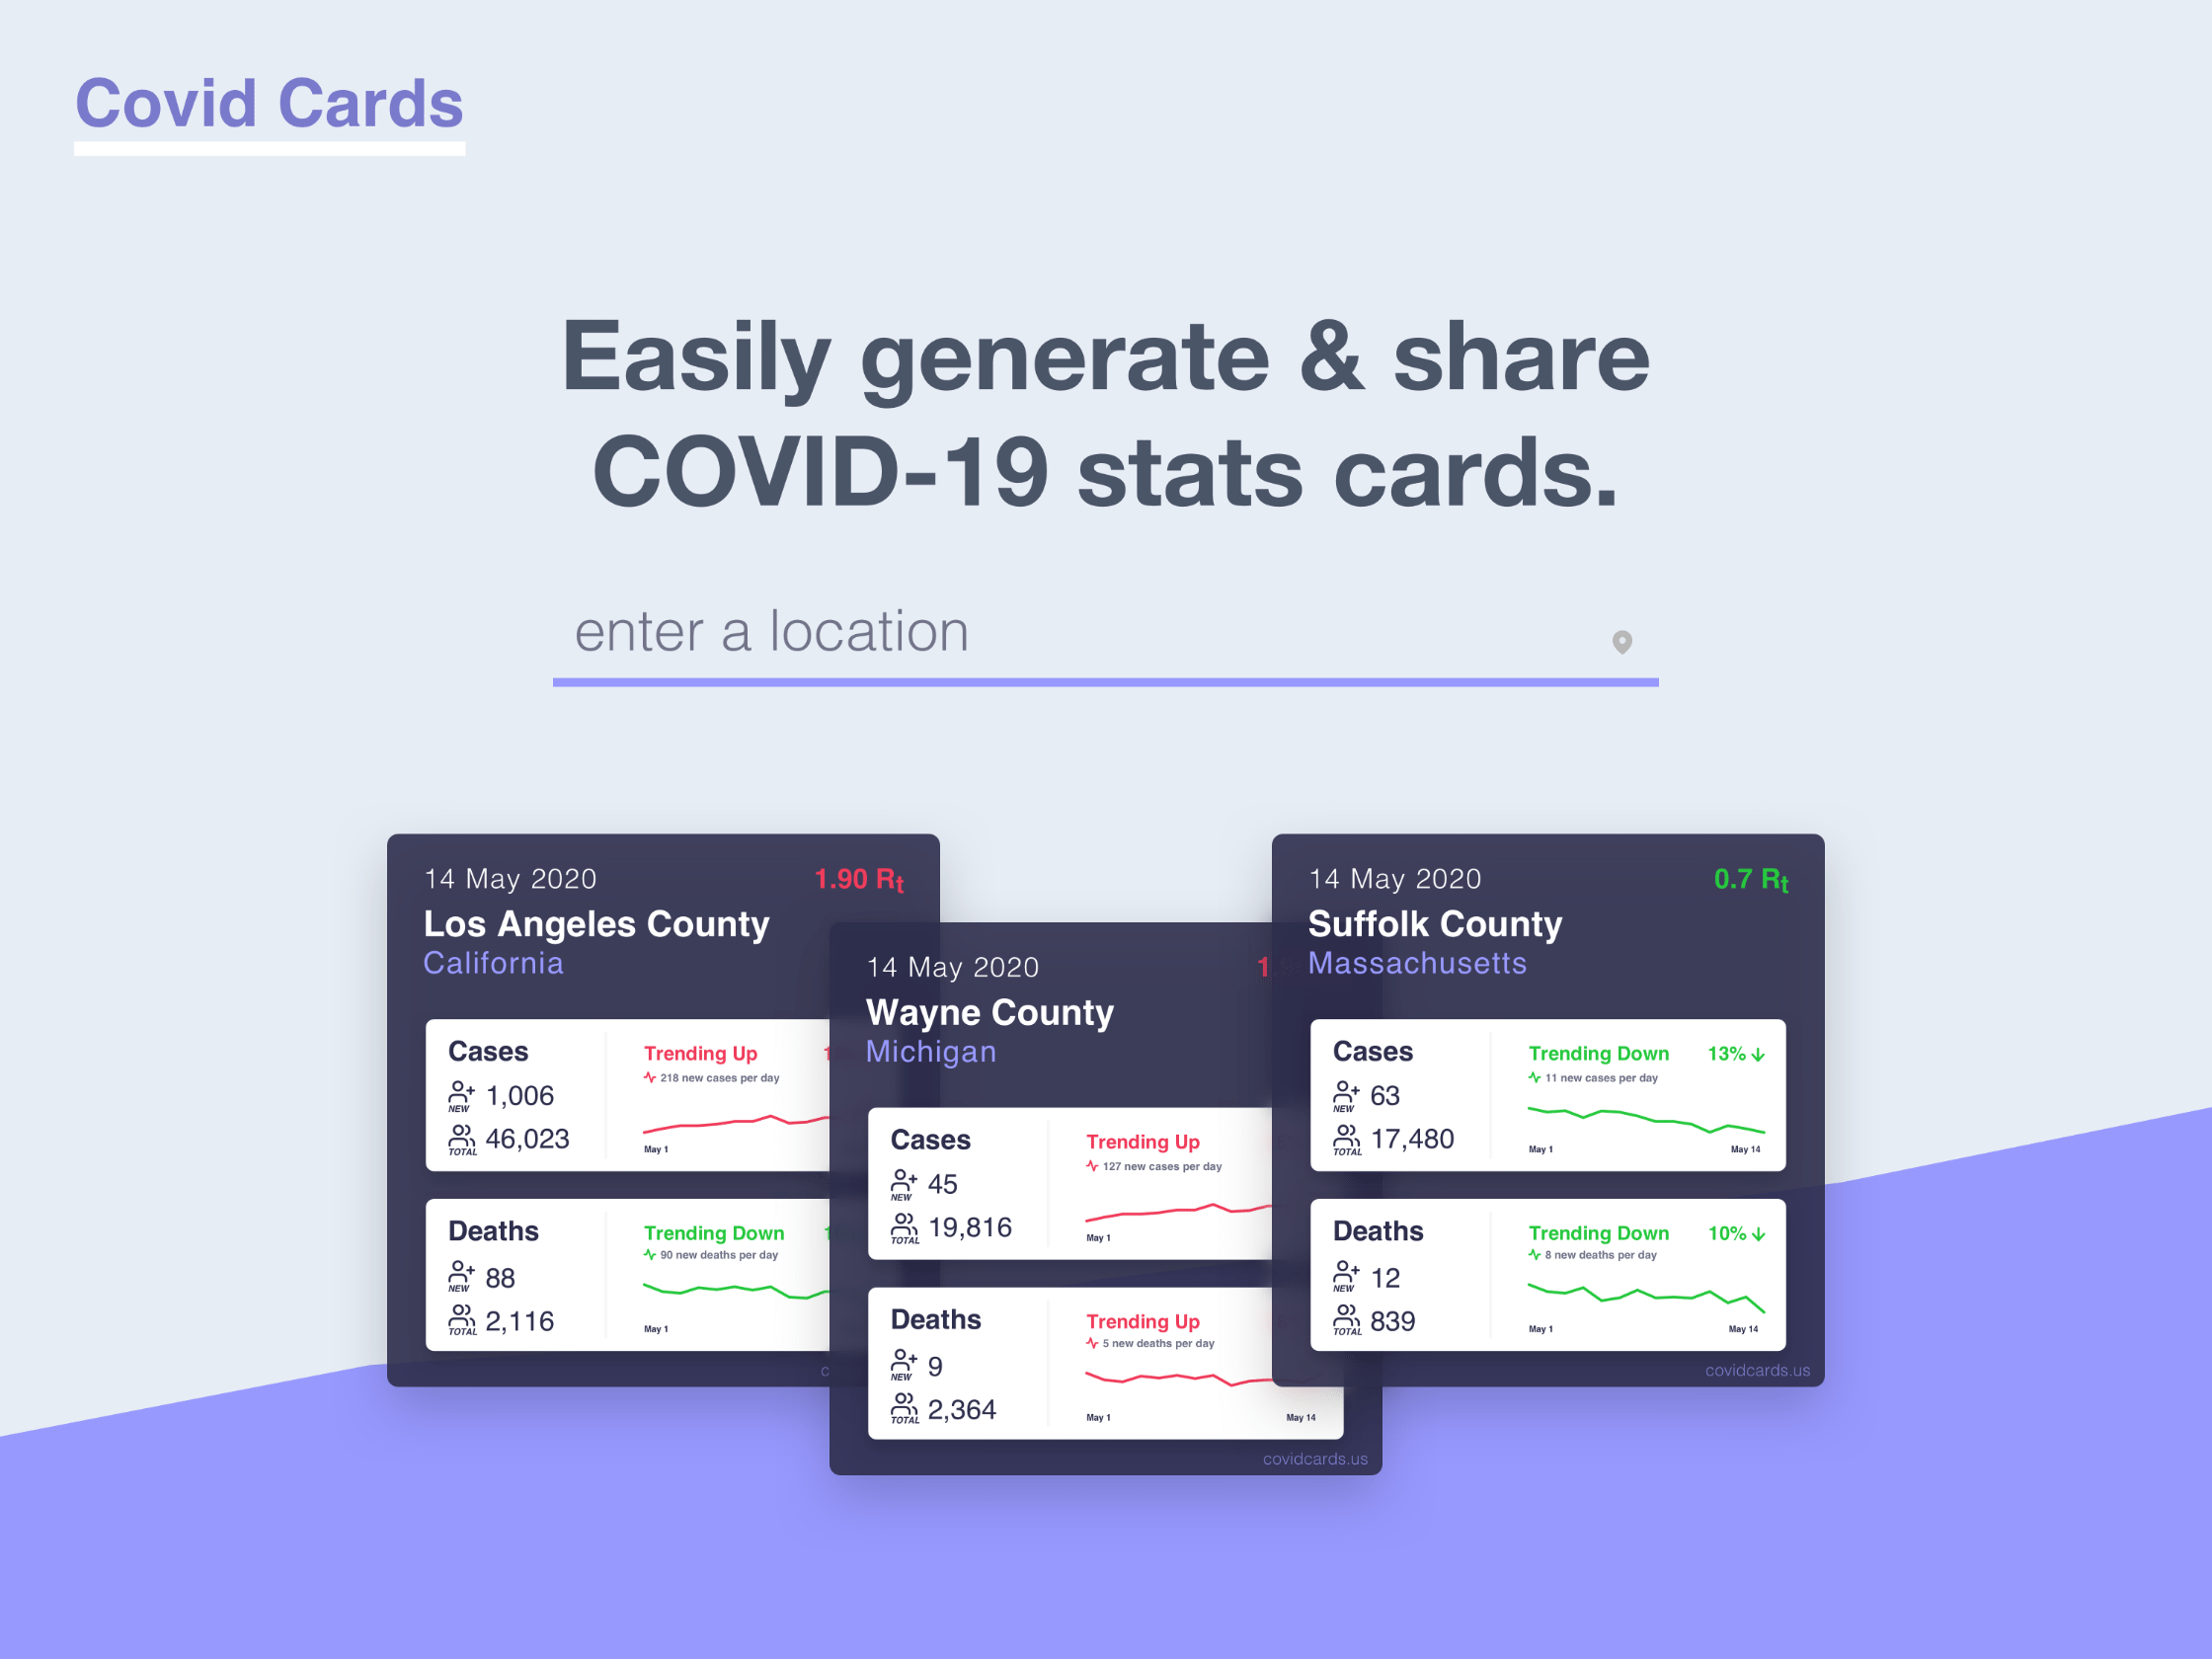
Covid Cards was a passion project that Stephen Erke and I created quickly over two weeks. The site allowed you to enter your location and dynamically generate an image with Covid-19 stats for your county that you could share via social media, email, or text.
On this page
Search

Card Page

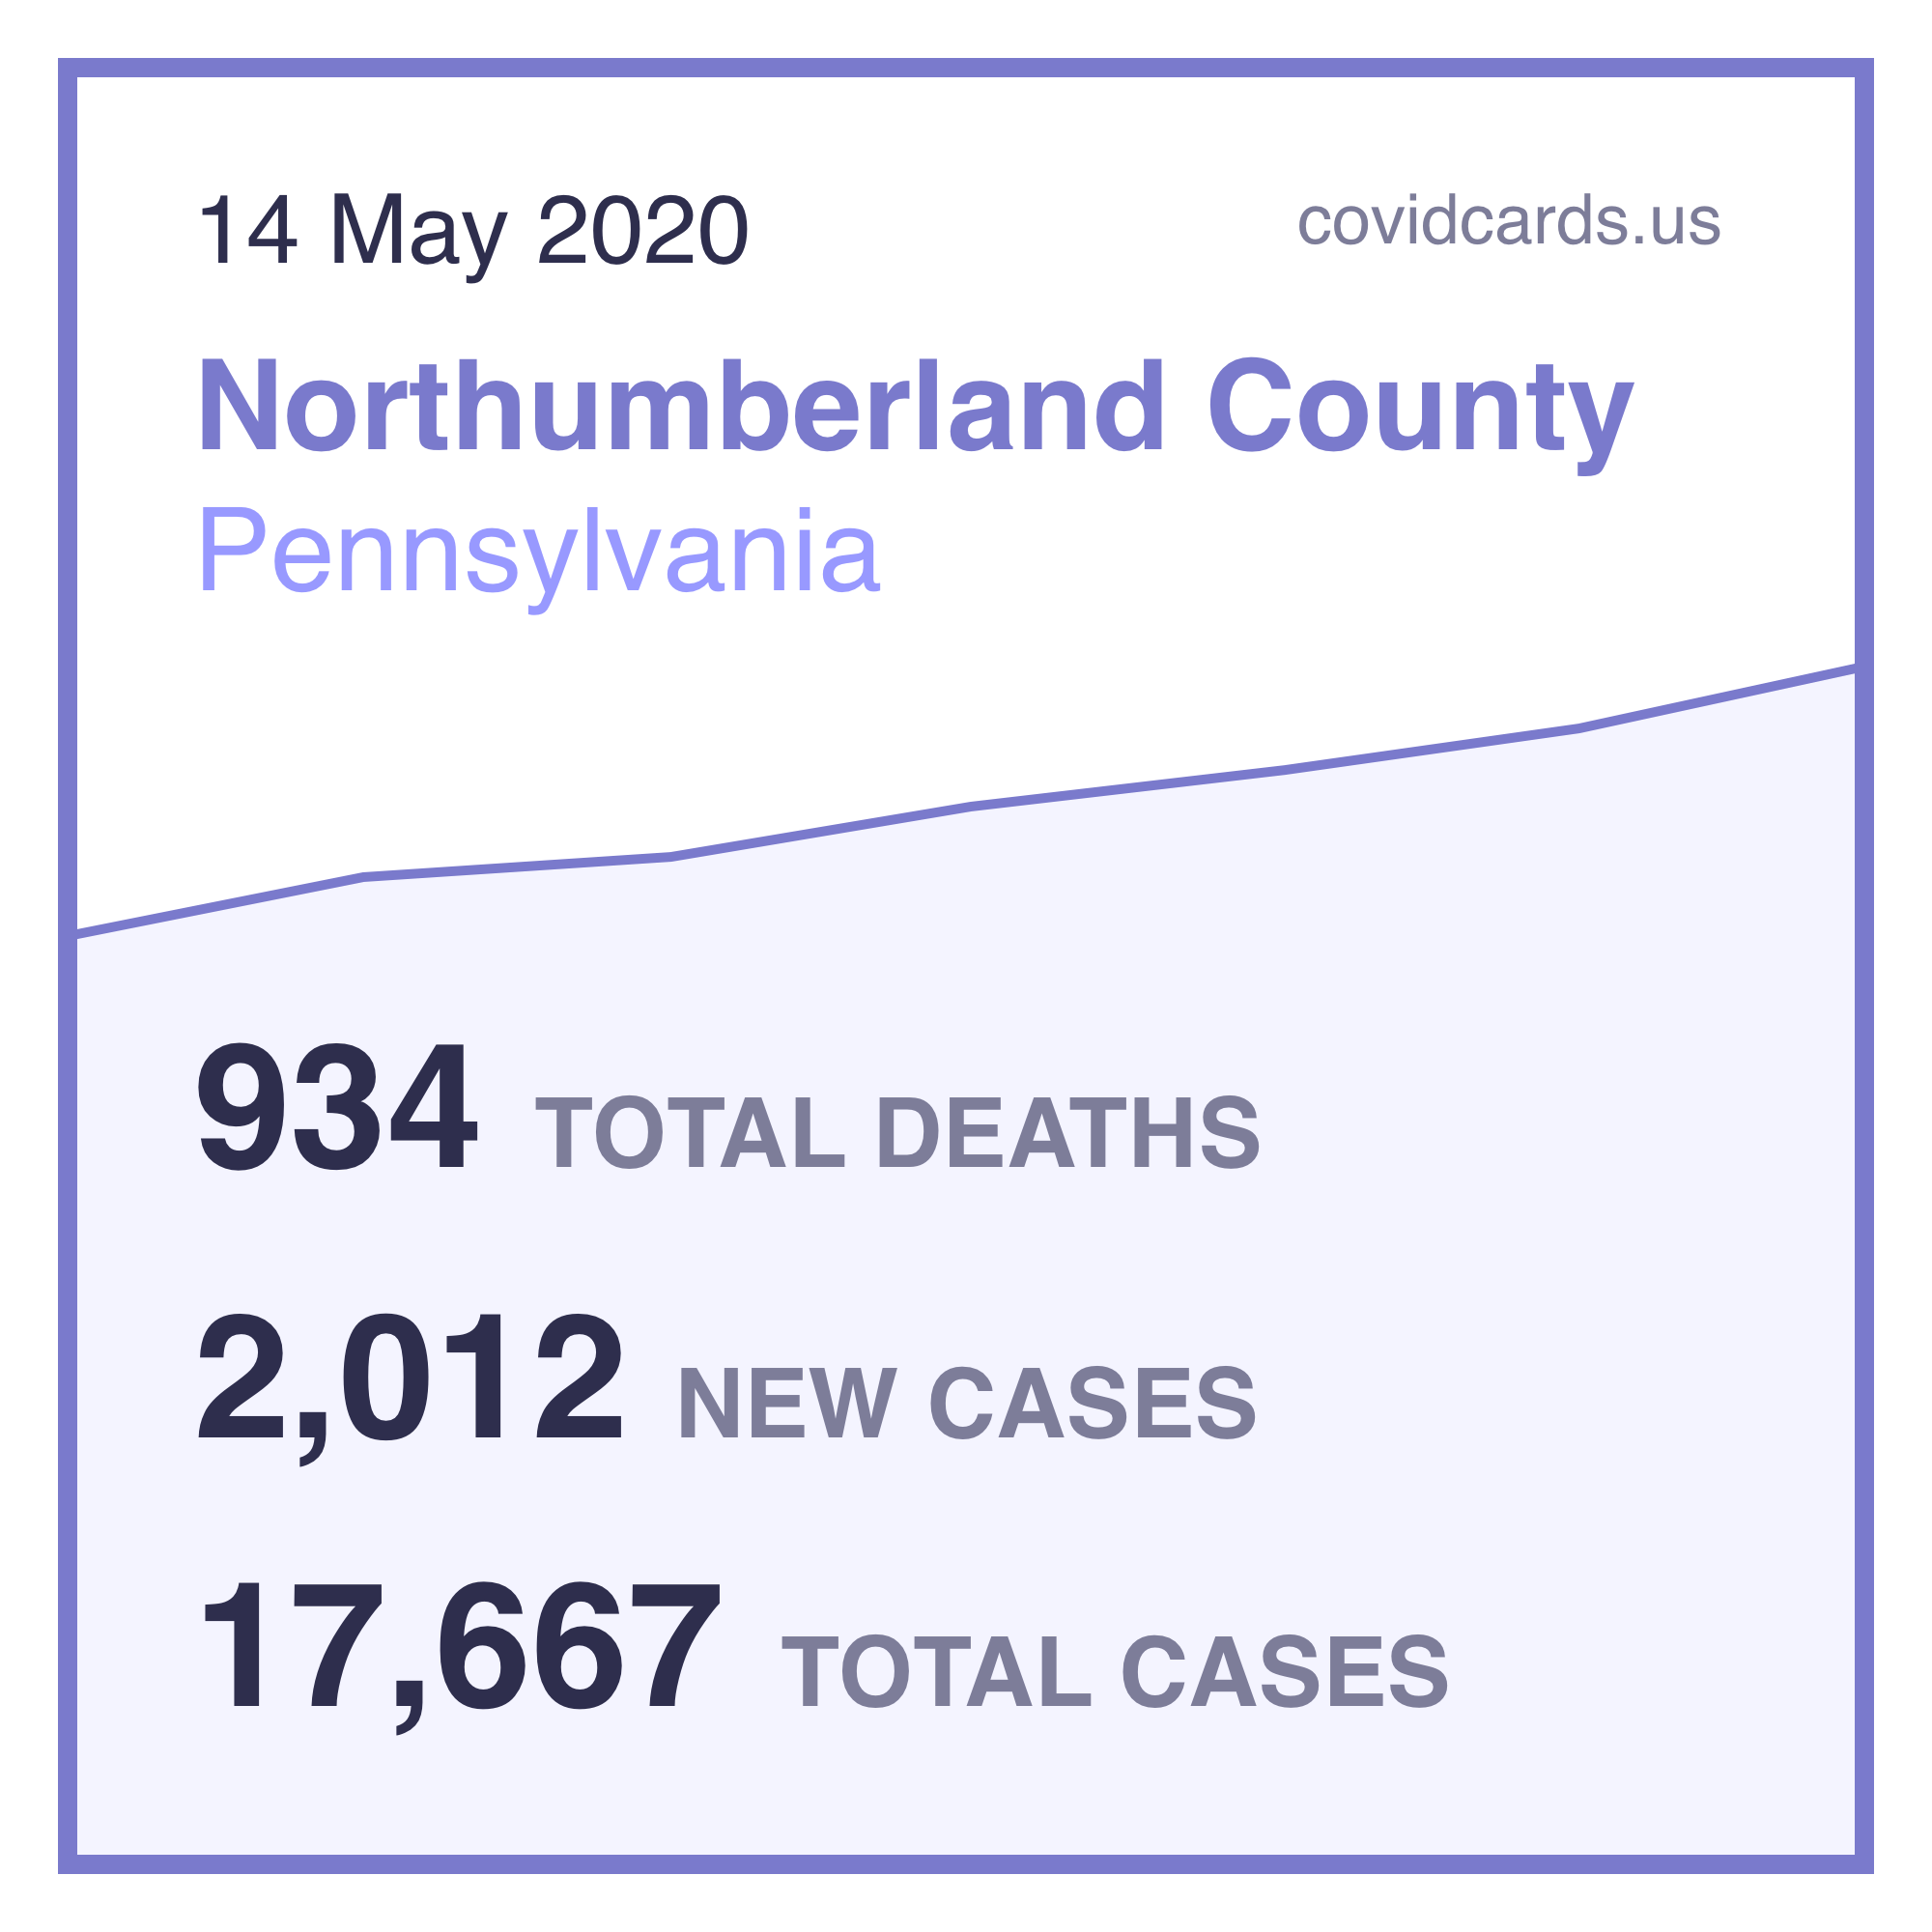
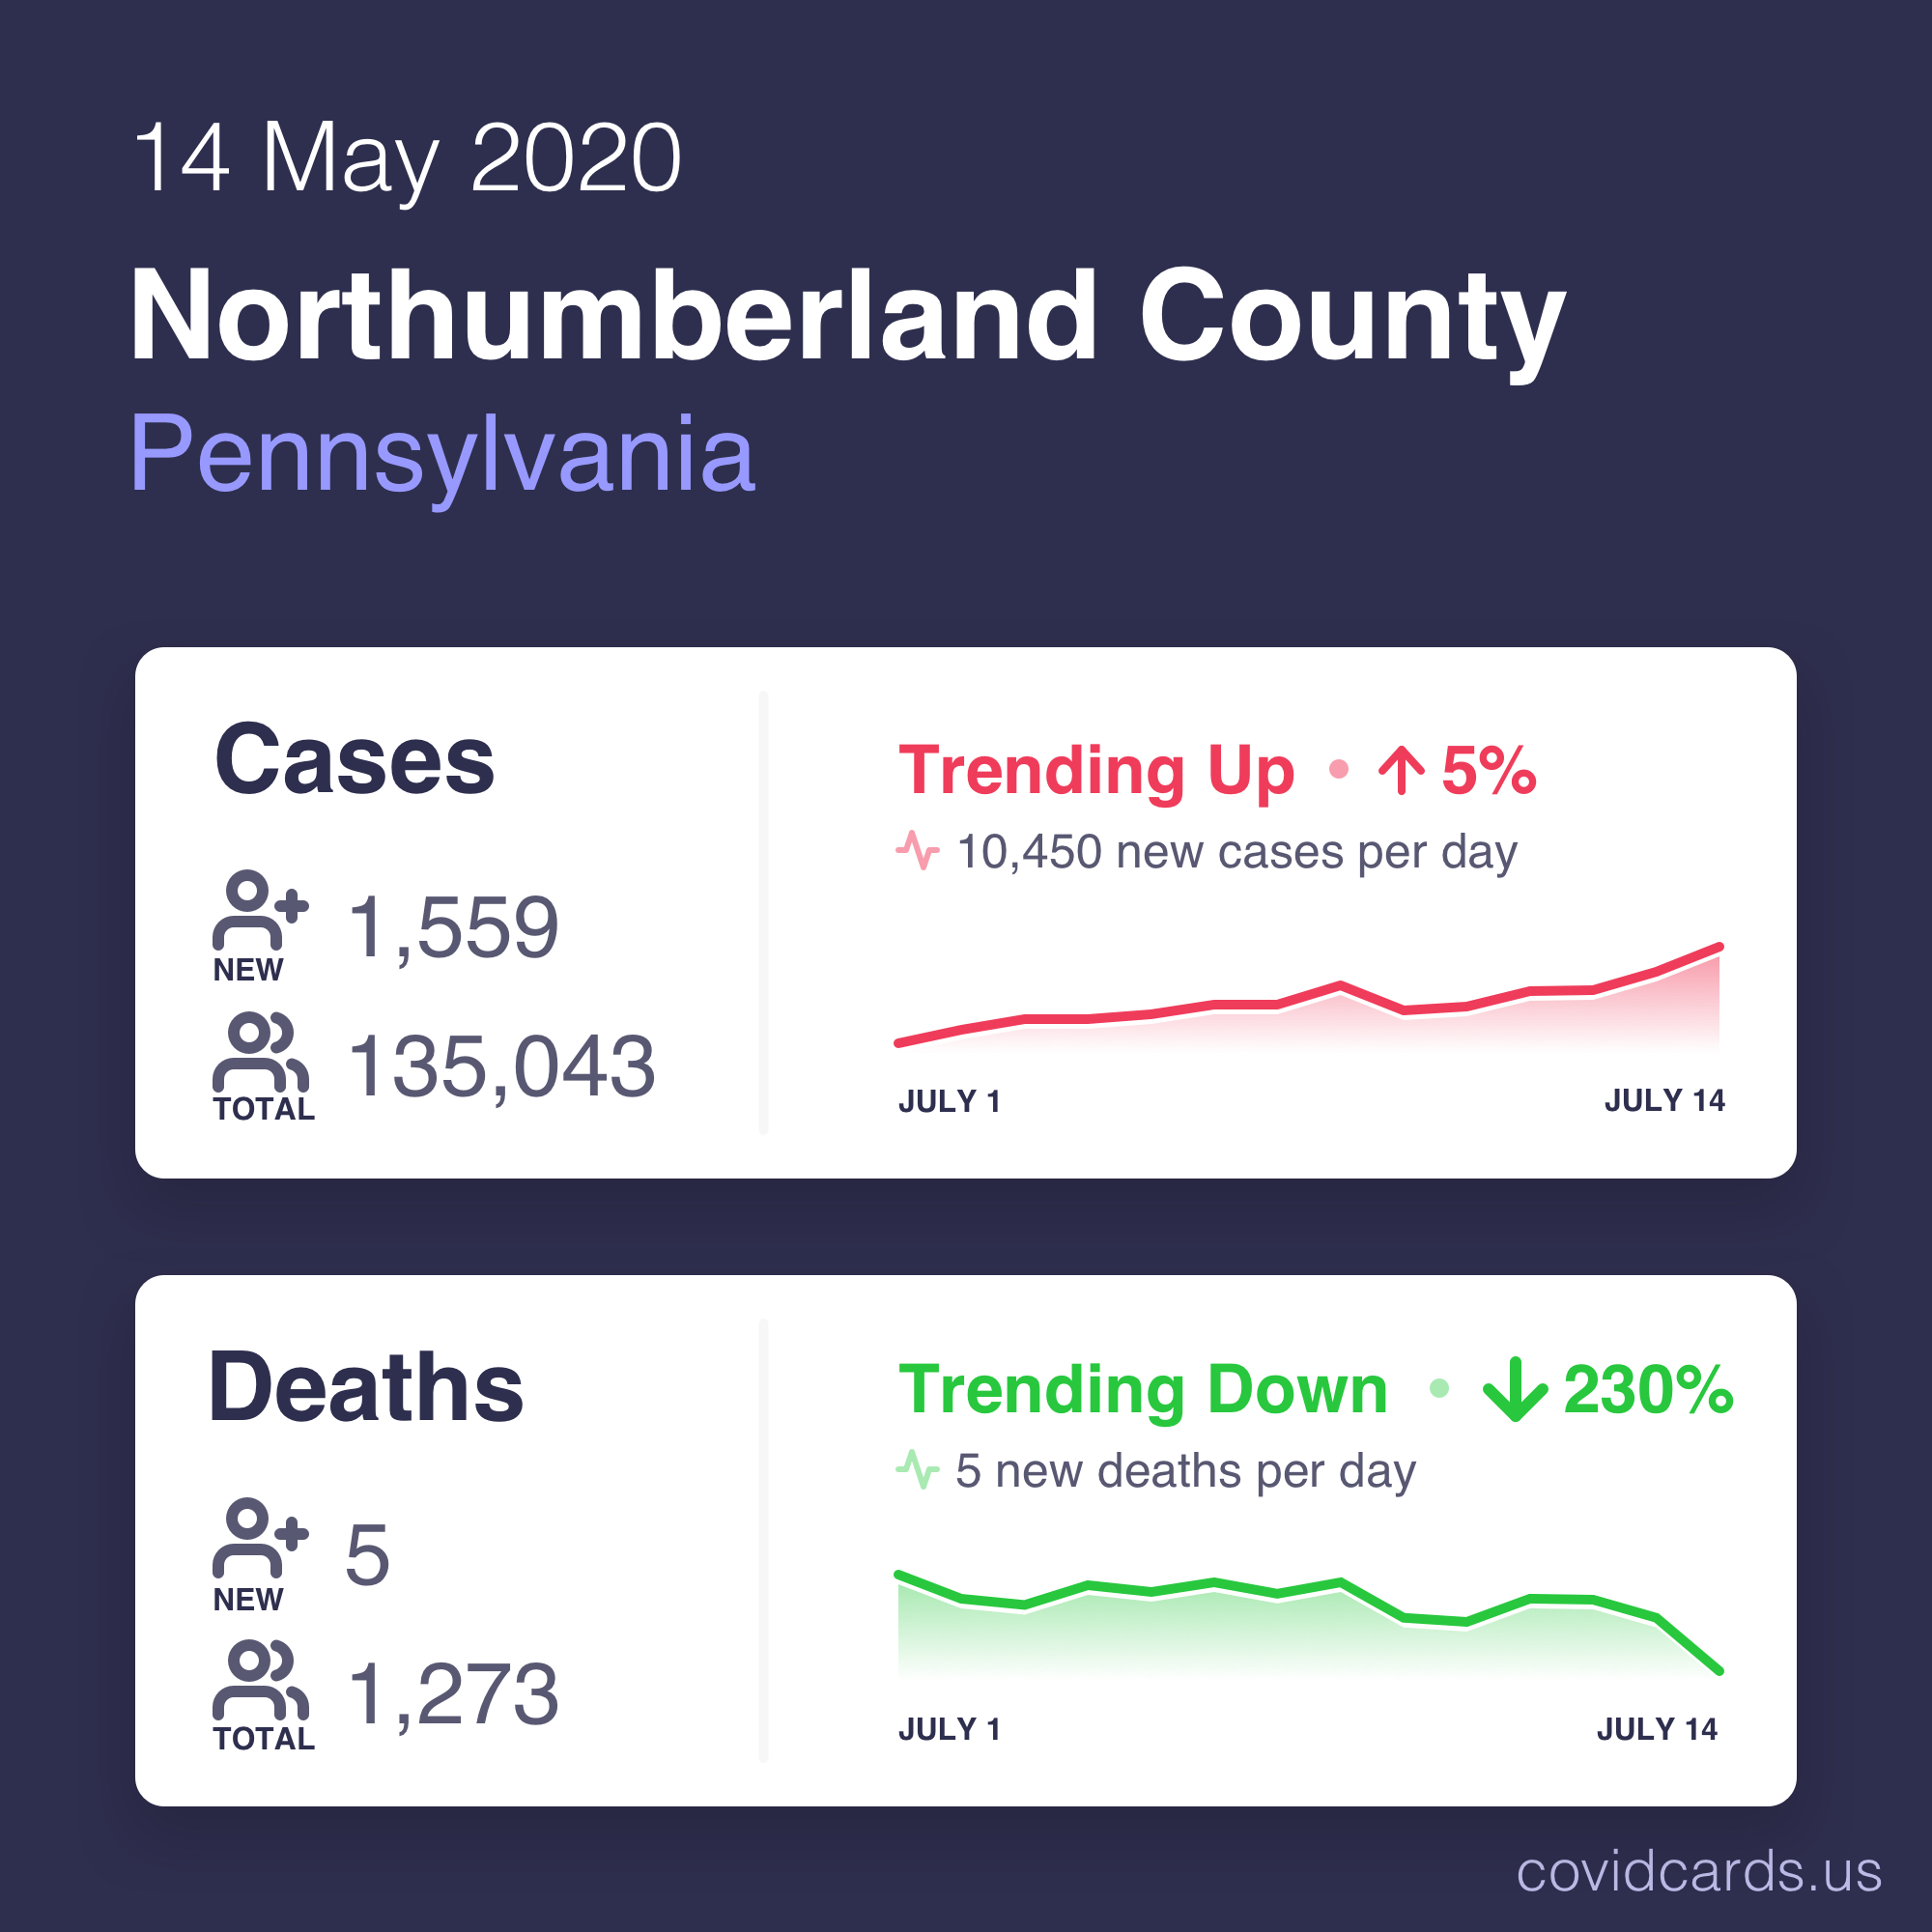
Example Card Designs

Data Engine
Collecting data ended up being easy for this project because we could leverage the data engine that we built for Readable Report. We collected data from disparate data sets, including John Hopkins, The New York Times, Wikipedia, and more.
We merged, normalized, and aggregated the data into one unified set and stored it as a time series. We built a serverless API with AWS Lambda and API Gateway with endpoints for the country, state, and county and filtered each endpoint by a date range.
In later sprints, we did a statistical analysis to identify trends, which helped show the direction the numbers were moving over a two-week period.
Image Generation
For the cards to be shared easily, we needed to generate them as images. Another hurdle was that each social media platform required the images to be a different size. We were able to accomplish this by creating an SVG to use as a template with variables that we could replace with actual data. We then rendered the SVG to a string and used the fantastic Sharp image library to convert the SVG to a PNG on the fly. Doing this allowed us to create images dynamically, but we didn't want to do that every time an image was requested. To solve that problem, we decided to take it to the Edge!
CDN & Edge Location
Lambda@Edge uses the CloudFront CDN to execute code at edge locations. Leveraging this allowed us to create the images dynamically on the first request and then cache them for subsequent requests. Since the request was close to the user, the response time was almost instant.